I was recently tasked with solving a fun epidemiology puzzle for one of my university classes. Below is an excerpt from the assignment describing the scenario.
11 people get sick enough to go to a local hospital with severe diarrhea and vomiting that lasts four days or so in each patient. All the patients turn out to all have the same strain of norovirus.
It turned out that they all knew each other and over the summer had been sharing produce from their gardens. The nurse’s hypothesis was that one person had norovirus, and had transmitted the virus to others on the food. She made a list, numbered the patients, starting with the patient that had first shared, and who they had shared with. It turned out a total of 16 people had shared produce, so she contacted the additional people who had not gotten sick, and asked them who they had shared produce with and when. In the end, she came up with the list below. So, patient 1 first shared vegetables with patient 12, then with patient 14. Patient 2 first shared vegetables with patient 5, then with patient 15, and so on. And patient 1 never got ill, while patient 2 did. Any time that two people come in contact with each other, the virus can move either way. For example, it would be possible for patient 2 to have infected patient 5, or patient 5 to infect patient 2.
After studying the list, she said, “I know who started this!” She asked that patient where they had been recently and it turned out they’d been on a cruise ship that had had a severe outbreak of norovirus! Based on her data, which patient was the one who went on the cruise and started the epidemic?
Data
Below is the dataset of patients and who they met with.
| Patient | Meetings | Sick |
|---|---|---|
| 1 | 12,14 | FALSE |
| 2 | 5,15 | TRUE |
| 3 | 6,16 | TRUE |
| 4 | 1,7,11 | TRUE |
| 5 | 10,3,16 | FALSE |
| 6 | 13,2 | FALSE |
| 7 | 2,8 | TRUE |
| 8 | 3,10 | TRUE |
| 9 | 15,5 | TRUE |
| 10 | 9 | TRUE |
| 11 | 14 | TRUE |
| 12 | 13,15 | FALSE |
| 13 | 16,3 | TRUE |
| 14 | 9 | TRUE |
| 15 | 16,5 | FALSE |
| 16 | 9 | TRUE |
Rules
So based on the above passage we can derive some simplified rules to use in solving the puzzle
- Meetings happen sequentially going left to right
- Rows are in chronological order going top to bottom
- We don’t move onto the next row until all the meetings of the current row are complete
- Each meeting has only two people
- When two people meet the disease can go either direction
Solution
Theory
To solve this we need to find an algorithm that can identify patient zero based on their interactions with others. At first, I thought about using a graph-based approach to model each meeting, but the temporal nature of the data makes that untenable. Instead, I opted for a much simpler and intuitive approach that takes advantage of the ordering.
Since we know the precise sequence in which meetings occurred and we know that each meeting contains only two people we can generate a list of interaction tuples from the dataset. For example, 1 meets with 12, then 14, and then 2 meets with 5. So we could have a list like so:
[(1, 12), (1, 14), (2, 5)]Once we have our sequential list of interactions we can iterate through them to simulate the effect of any given individual being patient zero. Then it’s just a game of trial and error trying out different possible patients. If we find a contradiction in our simulation based on the data we were given (ie. someone gets sick in the simulation but was healthy in the table) then we know that our guess for patient zero was wrong and can move on to the next one. But if we get all the way to the end of the simulation and everyone who was supposed to get sick is sick and everyone who was supposed to be healthy is healthy then we found our culprit.
Code
So now that we have a game-plan, we just need to code it up and find out who got everyone sick.
We’ll be using the Pandas python library for working with our table.
import pandas as pdI’ve placed the table into a CSV file called data.csv which we’ll open as a Pandas DataFrame.
# Load the dataset into a DataFrame
df = pd.read_csv('data.csv')
We need to get the list of interactions in chronological order from the table. To do this I’ll use a Python generator to iterate over the rows and for each row I’ll split the meetings up and yield them.
def get_interactions():
    # Iterate through the rows of the DataFrame
    for index, row in df.iterrows():
        # Get each meeting in order
        for meeting in row['Meetings'].split(','):
            # Yield the interaction
            yield {row['Patient'], int(meeting)}
Great, so far so good. All we have left is the actual simulation to write. For this, what we’ll do is keep a list of patients who are sick in the simulation. It will start with just our guess for patient zero and grow as they interact with others.
When we iterate through the interactions there are three possible situations that can happen:
- The interaction has no sick people in it
- The interaction has one sick person and one healthy person
- The interaction has two sick people
If the interaction has no sick people or two sick people then we just move along to the next one. But if it has one sick person and one healthy person then we need to make the healthy person “sick” by adding them to the sick_people set. However, before doing that we check with our real data to see if the healthy person was recorded as being sick. If they were then they get added and we keep going, but if they are supposed to be healthy then we know that our hypothesis was wrong and can return False.
Finally, if we make it through all of the iterations without invalidating our hypothesis then it must be true and we will return.
# Test if our patient zero hypothesis is correct
def test_hypothesis(id, interactions):
    # A set of sick people in the simulation
    # starts with just patient zero
    sick_people = {id}
    # Iterate over the interactions in
    # chronological order
    for interaction in interactions:
        # Check if the interaction has at least
        # one sick person in it
        if sick_people.intersection(interaction):
            # If there is a sick person then
            # check if everyone in this interaction
            # was supposed to get sick.
            for person in interaction:
                # If they were then add them to the set
                if df[df['Patient'] == person]['Sick'].bool():
                    sick_people.add(person)
                # If they weren't then we are done and
                # can return False
                else:
                    return False

    return True
Alright, well that’s it! Just add a few more lines of code to run our functions and let’s see who it was.
# Get list of interactions
interactions = list(get_interactions())
# Iterate through the 16 candidates
for candidate in range(1, 17):
    # Check if our guess is correct
    if test_hypothesis(candidate, interactions):
        # Yay! We found them.
        print('It was {}!'.format(candidate))
        break
Run it!
(env) kyle@IntelNuc:~/Code/Python/Virus Spread$ python who_did_it.py
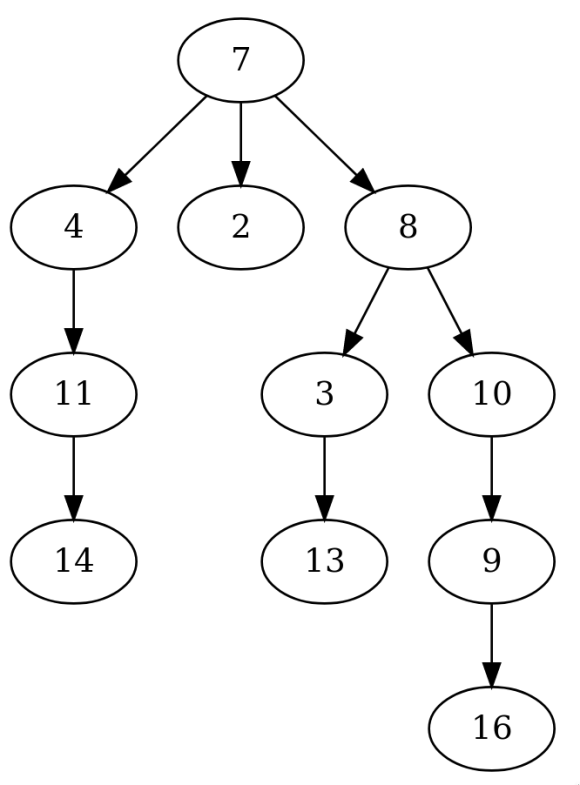
It was 7!Well, it looks like it was patient #7 who got everyone sick. Mystery solved.
I decided to write another script using similar code to produce a tree diagram of the infection which is pictured below. As you can see the norovirus does indeed start with patient #7 and moves to all of the other sick people from there. I encourage you to follow the path of the tree through the table to confirm the results for yourself.