I’ve been using YNAB for a few years now, but the way I organize my budget today is very different from how I started.
Before YNAB, I used Mint. Mint encouraged a fairly traditional approach to budgeting: transactions were automatically sorted into categories like groceries, restaurants, rent, entertainment, and transportation.
When I moved to YNAB, I initially tried to recreate that structure. It didn’t work particularly well for me.
The problem was ambiguity. I’d buy something that didn’t fit neatly into any existing category, so I’d create a new one just for it. Other purchases could reasonably belong to two or three categories, forcing me to make arbitrary decisions about where they belonged.
After a few months, I scrapped the whole thing and started over.
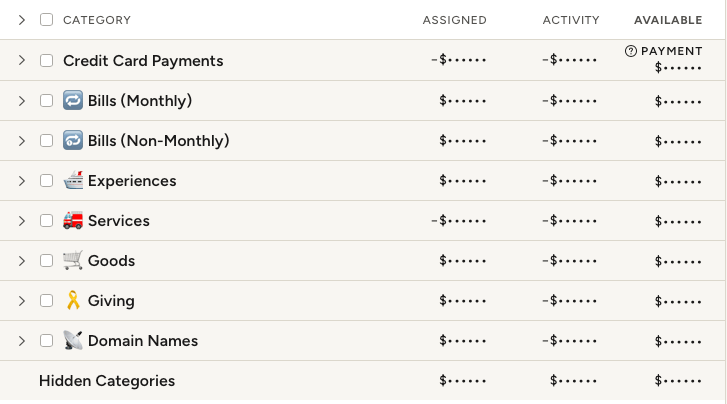
The system I came up with has now remained mostly unchanged for two or three years. Instead of trying to create a category for every conceivable type of purchase, I organize spending around a small number of broad concepts with rules that tell me where almost any transaction belongs.
Bills: Monthly and Non-Monthly
The first meaningful distinction is recurring expenses.
I have two category groups:
- Bills — Monthly
- Bills — Non-Monthly
Monthly bills include things like rent, home internet, my cell phone, and streaming subscriptions. Non-monthly bills cover recurring expenses that happen less frequently, such as my annual Amazon Prime membership or an insurance premium.
I use YNAB’s Refill Up To targets for these categories. I generally set the target slightly higher than I expect the bill to be. Any small surplus rolls over, and the following month YNAB only asks me to contribute enough to bring the category back to its target.
This works well because these aren’t really things I’m “saving” for indefinitely. There’s simply an amount of money I want available when the bill arrives.
Experiences

My fun spending lives under a category group called Experiences.
Most of the time, there’s just one permanent category inside it, also called Experiences. Restaurants with friends, movies, bowling, and other recreational activities all come out of this category.
I deliberately don’t distinguish between restaurants, movies, entertainment, and similar categories. What matters to me is that I’m spending the money on an experience.
Large planned experiences work a little differently.
For example, I currently have a trip to Universal Studios Orlando coming up. Rather than dumping the money I’m saving for the trip into the generic Experiences category, I created a temporary Universal Orlando Trip category. I can save specifically for the trip, pay its expenses from that category, and see how much of the trip budget remains.
When the trip is over, I’ll merge the category back into Experiences.
That gives me the advantages of detailed budgeting when I’m planning something expensive without permanently cluttering my budget with categories for every vacation I’ve ever taken.
Experiences uses a Monthly Savings Builder target. That’s an important distinction from my bills.
If I budget $500 for experiences one month and only spend $300, I don’t want YNAB to tell me that I only need another $200 next month. I want to add another $500. The unspent $200 represents additional money I can spend on experiences in the future.
In other words, underspending isn’t a reason to reduce next month’s allocation.
Services
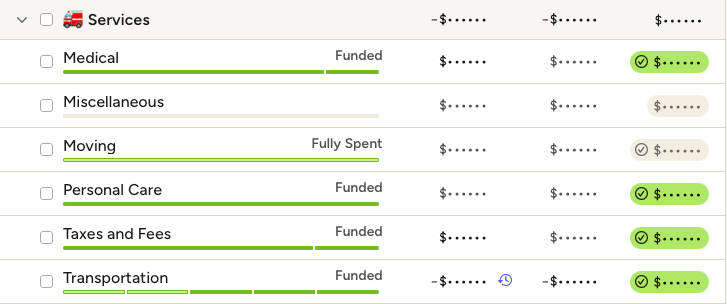
My next category group is Services.
The basic rule is simple: if I’m paying someone to do something for me, and it isn’t primarily a recreational experience, it’s probably a service.
That includes things like haircuts, medical care, movers, and transportation.
Transportation is one of the biggest categories here because I don’t own a car. Subway and bus fares, Uber and Lyft rides, plane tickets, and long-distance train tickets all go into Transportation.
There is some unavoidable ambiguity here. A plane ticket to Orlando is simultaneously transportation and part of my Universal trip.
I’ve decided that consistency matters more than finding some philosophically perfect answer. If something is transportation, I categorize it as Transportation.
If the transportation is part of a larger trip I’ve been saving for, I can move money from the trip’s category into Transportation to cover it. The transaction itself still gets categorized consistently.
Targets within Services depend on the nature of the expense.
Transportation uses Refill Up To because spending less on transportation this month doesn’t mean I expect to spend correspondingly more next month.
Medical, on the other hand, uses a Monthly Savings Builder. Medical spending can be sporadic and expensive, so I want unused money to accumulate over time.
Goods: Consumables, Durables, and Intangibles
Goods were one of the biggest sources of frustration in my original Mint-style budget.
There are effectively infinite kinds of things you can buy. Trying to maintain separate categories for clothing, electronics, furniture, household supplies, groceries, toiletries, and every other conceivable product creates endless edge cases.
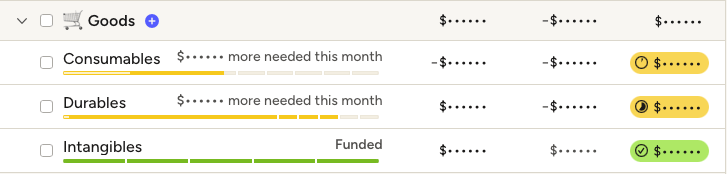
I eventually settled on three categories that can accommodate almost any good:
Consumables are physical goods that are used up relatively quickly. Groceries, toilet paper, toothpaste, laundry detergent, dishwasher detergent, and similar purchases belong here.
Durables are physical goods intended to last. Furniture, televisions, smartphones, laptops, and similar purchases go here.
The boundary between the two is a little fuzzy as almost everything eventually wears out, so I use a rough one-year rule. If I expect something to last less than a year, it’s probably a consumable. If I expect it to last more than a year, it’s probably a durable.
Intangibles are goods that aren’t physical at all. Buying an app for my phone, a digital movie, or a downloadable Xbox game would fall into this category.
Like Experiences, I sometimes create temporary categories for particularly large purchases.
If I were saving for a new iPhone, for example, I might create an iPhone category and contribute money to it for several months. Once I bought the phone, I’d merge the category into Durables.
All three of my permanent Goods categories use Monthly Savings Builder targets.
Goods spending is inherently bursty. I might go several months without buying a significant durable good and then suddenly need to replace a broken television. I want the money I didn’t spend during those quiet months to accumulate so it’s available when that happens.
Giving

Giving has two categories: Charity and Gifts.
Charity covers donations to nonprofit organizations. Gifts covers money I spend on friends and family for birthdays, Christmas presents, and similar purchases.
Although both represent giving money to someone else, their spending patterns are different.
My charitable donations are relatively predictable and largely automated, so Charity uses a Refill Up To target.
Gifts are much more irregular. There might be relatively little spending for months followed by a cluster of birthdays or an expensive Christmas season. Consequently, Gifts uses a Monthly Savings Builder so money accumulates during quieter months.
Domain Names
Finally, I have one highly specific category group: Domain Names.
Each domain I own gets its own category with a target based on its renewal date and price. YNAB gradually sets aside enough money so that the renewal is fully funded when it arrives.
Technically, I could put these under Non-Monthly Bills. They’re recurring annual expenses, after all.
But I own enough domains that doing so would clutter up the rest of my bills. Giving them their own group keeps things cleaner.
The Principle Behind the System
The biggest lesson I’ve taken from designing this budget is that categories don’t need to perfectly describe every purchase.
My first budget that mimicked the categories I was used to in Mint was overly specific and it resulted in nearly 120 unique categories. It made it more difficult to try to figure out what was the correct category for each transaction.
My current system is deliberately broader.
A physical item is a consumable or durable. A digital item is an intangible. Paying someone to do something is generally a service. Doing something for fun is an experience. Giving money away is charity or a gift. Recurring obligations are bills.
There are still edge cases. A plane ticket for a vacation could reasonably be Transportation or Experiences. Rather than trying to eliminate every ambiguity, I’ve established rules and apply them consistently.
For expenses with a relatively stable ceiling, I use Refill Up To. For expenses where I want underspending today to increase my purchasing power tomorrow, I use Monthly Savings Builder.
And when I’m saving for something unusually large like a vacation or an iPhone, I temporarily give it its own category and merge it into the appropriate permanent category afterward.
The result is a budget that gives me detail when that detail is useful without requiring me to maintain hundreds of categories forever.
After several years of using it, that’s probably the strongest evidence I have that the system works: I feel no need to redesign it.