Blog

  • Rethinking Fault: Are City Planners to Blame for Car Crashes?

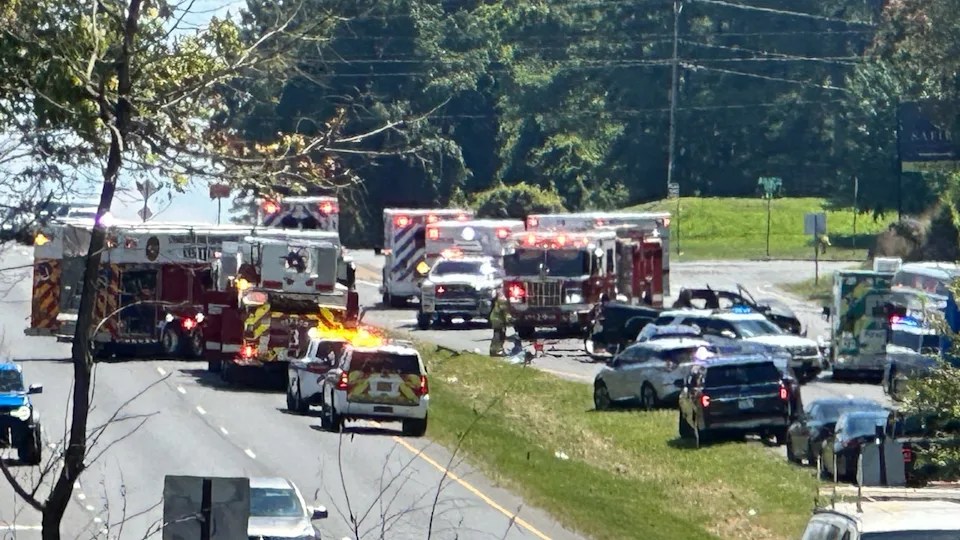
    We like to think of car crashes as the fault of individual drivers. Someone was distracted, drunk, careless, or reckless. But I don’t think that’s the full story. I think the real blame belongs to the people who designed the cities that make driving the only option in the first place.

    City planners and traffic engineers know that not everyone is good at driving. They know that some people have medical conditions, slower reflexes, or just aren’t equipped to operate heavy machinery safely. They know this, and yet they’ve built entire societies around the assumption that everyone can and must drive a car.

    So when someone who’s not a great driver gets into a car and causes an accident, who is really at fault? Is it the person who made a mistake, or the people who designed a city where that person had no choice but to drive?

    If you’ve created a system where the only way to get to work, school, or the grocery store is to operate a two-ton machine at highway speeds, knowing full well that not everyone can do that safely, then you are responsible for what happens next. You can’t act surprised when the predictable becomes reality.

    Even “safe” roads in America are not truly safe. Engineers brag about wide lanes, big medians, guardrails, and bright signage. They call it “forgiving design.” But you can’t “forgive” the fact that every trip still requires people to pilot deadly machinery at lethal speeds.

    Every hour of every day, someone dies in a car crash. And we call them “accidents,” as if they were random or unavoidable. But they’re not random. They’re built into the design. The engineers who made these roads could tell you exactly how many people will die on them each year. They run those models. They know the numbers. And they build them anyway.

    Drunk driving is the perfect example of how our urban design fails us. Nobody is saying people should drink and drive. But when it’s common, that’s a symptom of terrible planning.

    If someone wants to have a few drinks, they should be able to do that without risking their life or anyone else’s. In most American cities, that’s not possible. You drive to the bar because there’s no other option. You can’t walk because there’s no sidewalk. You can’t take a bus because it either doesn’t exist or stops running early in the evening. You could take an Uber, but that’s expensive. So people rationalize. “I’ve only had one or two. I’ll be fine.”

    And here’s the kicker: cities require bars to have parking lots. They literally make it illegal to open a bar without providing a place for people to park their cars. They are mandating a system that encourages drinking and driving. Then they turn around and lecture us not to do it. It’s absurd.

    Meanwhile, in Europe, you can walk to a bar. You can take a tram home. You can go out, drink, and get home safely. The safe option is also the convenient one. In America, the safe option barely exists.

    Here, if you don’t want to drive, you’re out of luck. You either pay for expensive rideshares or risk walking along a strode with no sidewalk. So people drive, even when they shouldn’t. And when something goes wrong, we blame them.

    But the truth is, most of these “bad drivers” are just doing what the system forces them to do. They’re acting rationally inside a setup that makes the rational thing dangerous.

    Traffic engineers like to say they’re just following orders. “The city told us to widen the road, so we widened it.” But that’s not good enough. If someone told them to build a bridge they knew would collapse, would they do it? Would they sign off on something they knew would get people killed?

    Of course not. Yet they do it all the time with roads. They sign off on stroads that they know will lead to hundreds of deaths a year. They approve designs that make walking, biking, and transit impossible. They don’t want to kill anyone, but they don’t care enough to stop. And that indifference is deadly.

    When someone dies in a car crash, we talk about personal responsibility. But we almost never talk about the people who built the environment that made that crash inevitable.

    Drivers might hold the steering wheel, but it’s the planners and engineers who paved the road, set the speed limits, banned mixed-use zoning, and made driving mandatory. The blood isn’t only on the drivers’ hands. It’s on the people who built a system that forces everyone to do something dangerous just to live their lives.

    If we actually want to stop the death and destruction, that’s where we need to start looking.

  • Death by Poor Urban Planning

    Every time we hear about a tragic car crash, the story is usually framed around individual blame. Someone made a mistake, someone wasn’t paying attention, or someone was reckless. But beneath these headlines lies a harder truth. Our urban design itself creates the conditions for these deaths. Poor urban planning is not just an inconvenience or an aesthetic misstep. It is a public health crisis that costs lives every day.

    In too many American cities, Charlotte included, roads are engineered like highways. They are wide, fast, and hostile to anything but cars. Corridors such as Independence Boulevard prioritize vehicle flow over human life, encouraging high speeds and leaving pedestrians and cyclists exposed. In this environment, even a brief lapse of focus, just a few seconds, can turn a mistake into a tragedy.

    Accident on Independence Boulevard, Charlotte NC injuring 6 people

    Just a few hours ago, as I write this post, there was an accident on Independence Boulevard that sent six people to the hospital, one with severe life-threatening injuries. It is tempting to place all of the blame on a driver going too fast. The harder truth is that the driver was simply responding to incentives created by reckless city planning, such as wide lanes, high speed limits, and a lack of safe transit alternatives. If the road had been designed to slow speeds and protect people, it is likely this crash would not have been so devastating or have happened at all.

    And incidents like this are far from rare. The Charlotte-Mecklenburg Police Department website listed seven similar traffic events in just the past three hours alone.

    To err is human. Every driver will make mistakes behind the wheel, such as misjudging a turn, glancing at a phone, or reacting a second too late. A safe transportation system recognizes this reality and builds in forgiveness. Narrower lanes, slower speeds, and protective infrastructure can ensure that a mistake does not automatically mean death. But our current design does the opposite. It demands flawless driving from every user, every second. That is not just unrealistic. It is negligent.

    There is another layer to the problem. Many people simply should not be behind the wheel of heavy machinery. Teenagers, seniors, those with medical conditions, or people who are poor drivers are still forced to drive because cities have left them with no alternatives. By designing systems where car travel is the only viable option, we compel people into dangerous situations that put their lives and the lives of others at risk.

    The spread-out, car-dependent development pattern of low-density housing, long commutes, and seas of parking creates endless demand for driving at higher speeds. Strong Towns and other urbanist voices have long warned that this model is both financially unsustainable and physically dangerous. More driving leads to more crashes, and higher speeds lead to more fatalities. The math is simple, and it is killing us.

    If we want fewer deaths, we must stop pretending this is about individual failure. Real safety comes from systemic change.

    • Slower streets with narrower lanes, traffic calming, and enforced lower speed limits.
    • Safe alternatives such as protected bike lanes, sidewalks, and reliable public transit.
    • Walkable, mixed-use communities where housing and jobs are close together, reducing the need to drive.
    • Equitable design that prioritizes vulnerable road users and invests in underserved communities.

    We call crashes “accidents” as if they were unavoidable acts of fate. They are not. They are predictable outcomes of policy choices, zoning codes, and street designs. Every fatal crash reflects a system that refuses to put people’s lives above the convenience of cars.

    Poor urban planning kills. With better choices and people-first design, we can build cities where human mistakes no longer cost human lives.

  • Perceived Life Percentage: Insights into Time Passing and Aging

    Have you ever noticed how, as you grow older, the years seem to pass by more quickly? Many people share this experience, and it’s not just your imagination. This phenomenon can be explained by several psychological and neurological factors, with one particularly interesting explanation known as the Proportional Theory.

    Understanding the Proportional Theory

    The Proportional Theory suggests that as we age, each year represents a smaller proportion of our total life, making time feel like it’s accelerating. When you are young, a year is a significant part of your life. For instance, to a 10-year-old, a year is 10% of their life. However, to a 50-year-old, a year only accounts for 2% of their life. This shift in proportion is a key reason why time seems to speed up as we age.

    A Formula for Perceived Life

    To quantify this feeling, we can use a formula based on the harmonic series. This approach involves calculating the perceived percentage of your life that has been completed at any given age. Let’s break it down:

    1. Proportional Contribution: Each year y represents 1 / y of your life at age y. The sum of these fractions up to your current age gives a measure of your perceived life.
    2. Harmonic Series: The harmonic series is the sum of the reciprocals of the first n natural numbers. For our purpose, we sum the reciprocals of each year up to your current age.
    3. Normalization: To get a meaningful percentage, we normalize this sum against the harmonic series sum up to an estimated lifespan, such as 80 years.

    The Perceived Life Formula

    Here’s how you can calculate the percentage of your perceived life completed at any age:

    Where:

    • A is your current age.
    • L is the estimated lifespan (e.g., 80 years).

    Let’s Do the Math

    Let’s consider an example with a 24-year-old person, assuming an estimated lifespan of 80 years. The steps are as follows:

    1. Calculate the harmonic sum up to age 24.
    2. Calculate the harmonic sum up to the estimated lifespan of 80 years.
    3. Normalize the harmonic sum of age 24 against the sum up to 80 years.

    Running this formula gives us a perceived life percentage of approximately 76.04% for a 24-year-old. This means that, based on the Proportional Theory and our harmonic series approach, a 24-year-old feels as though they’ve experienced around three-quarters of their life’s perceived time.

    Below is a table with the same calculation done for other ages.

    AgeLife ExpectancyPerceived Life Percentage Completed
    18020.14%
    108058.99%
    208072.46%
    308080.46%
    408086.17%
    508090.61%
    608593.12%
    709095.09%
    809596.67%
    9010097.98%
    10010599.07%

    Why This Matters

    Understanding why time seems to fly by as we get older can have profound implications for how we choose to live our lives. Recognizing that our perception of time accelerates with age can encourage us to seek out new experiences, break out of routines, and make the most of each year, regardless of how quickly it seems to pass.

    Final Thoughts

    The Proportional Theory provides a fascinating lens through which to view our perception of time. By quantifying this perception, we gain insight into why our childhood summers seemed endless, while our adult years feel like they pass in the blink of an eye. Embracing this understanding can help us live more fulfilling lives, cherishing each moment as it comes.

  • The relationship between college enrollment and tuition

    I spent my evening determining a reasonable expected growth rate for future college tuition. The graph below displays the correlation between college attendance rates and tuition. While I’m not concluding causation from the data, it seems plausible that increased enrollment rates have led to higher tuition costs. With enrollment now peaking at around 100% and appearing to decline, I anticipate a lower future growth rate. The historical growth rate was approximately 6%, but I’m considering a rate closer to 2% going forward.

    In the data attendance rate is defined as the number of people enrolled in college divided by the number of people aged 18-22 in the United States.
  • Low Risk Stocks Should Have Higher Risk-adjusted Returns than the Market

    • Leveraged constrained investors with high risk tolerance will invest more heavily in stocks that are riskier than the market
    • Investors with a lower risk tolerance than the market can deleverage very cheaply by holding some combination of cash and TSM
    • There is no reason for an investor seeking less risk than the market to invest in low beta stocks because they could instead just deleverage a portfolio with beta = 1.
    • The only reason for someone to hold low beta stocks is if they offer better risk adjusted returns than the market
    • If high beta stocks get bid up by leveraged constrained investors, then their risk adjusted returns will be worse than the market, consequentially low beta stocks must then have higher risk adjusted returns than the market
    • If low beta stocks do have higher risk adjusted returns, there are limits to arbitrage because leverage is not free
    • Low beta stocks should still underperform high beta stocks in absolute terms
  • How to make Office Online use OpenDocument format

    Did you know that Microsoft Office online can use either Microsoft Office format (docx, pptx, xlsx) or OpenDocument format (odt, odp, ods)? I didn’t until a commenter pointed it out.

    You can change the default file formats for Office documents from your OneDrive Settings. There is an option called Office file formats.

    Yovko Lambrev

    If you visit the OneDrive settings on their website there is an option to change between the two formats.

    OneDrive online settings to change office document format to OpenDocument

    Then if you create a new “Word document” by right-clicking in OneDrive

    OneDrive online right click dialog showing new word document

    It’s actually a OpenDocument ODT file!

    OneDrive online with two files open (one of them an ODT)

    Then you can click on it to open it in Word online.

    Microsoft Word online opening an ODT file

    Pretty neat!

  • Switching to WordPress.com

    For the past few years I’ve been hosting my blog on Linode, but I’ve decided to switch over to WordPress.com on their “Personal” plan since it was a bit cheaper.

    So far everything seems to be working well, and I was able to migrate over all of the posts, pages, and comments from my previous WordPress installation. However, WordPress.com doesn’t support the www subdomain which is annoying, so I either have to make it the naked domain (kylepiira.com) or use another subdomain like blog.kylepiira.com. Right now, I’ve opted for the naked domain, although I think it looks much uglier than the version with www.

    WordPress.com does not support the www subdomain

    Typical web developers, breaking something that’s worked for the last 30 years in favor of the new hotness.

    I also had to disable the AMP feature which is enabled by default by going through Settings → General → Performance.

  • Santa Rock

    I made some waffles and a small Santa hat for my pet rock.